


Digesting the data deluge: new customer experiences enabled by GenAI
Louise Clayton & Sathish Kannan share how ANZ is creating new experiences for their Institutional customers
An abundance of data
In today’s digital age, the sheer volume of data generated every second is staggering. From social media interactions to sensor data from IoT devices, the amount of information available is unprecedented.
This abundance of data represents a significant source of value for anyone that can harness it. But to date, that goal has been limited by human capacity. We are naturally limited in the volume of information we can see, digest and analyse.
Technology has helped lessen this constraint. Historically, data analysis has relied on techniques ranging from manual data entry and spreadsheets to data lakes and dashboards, delivered at scale via a ‘point and click’ interface. While these methods have served us well in the past, they become challenged when called upon to handle the complexity and scale of modern data. This is where Generative AI (GenAI) comes into play, offering innovative solutions to transform how we process and interpret data. GenAI and its use cases are developing at an incredible pace with real-world applications.
For businesses, this could lift data analytics out of the realm of the technical (or those fortunate enough to employ a team of data scientists) and place it in the hands of a broader range of people within an organisation, regardless of their technical expertise — it could play a crucial role in democratising data.
Dashboards: A vital tool
Notwithstanding the rapid evolution of GenAI, Dashboards continue to have an enduring role to play for us and our customers. Dashboards are an established and useful way of presenting data. They are:
Scalable – one dashboard can deliver insights to many users;
Interactive – allows users to drill into the data; and
Visual – can codify visualisations of the data that allow you to quickly see patterns, trends and outliers.
Dashboards like ANZ’s Economic Pulse — which allows Institutional customers to benchmark their business performance against industry, location, and demographic trends identified in our anonymised transactional data — continue to be of tremendous value to our customers.
They are the industry standard for a reason. But dashboards also have their drawbacks. They are:
Predefined – dashboards are typically static, and presented in a fixed way. The design, build, test cycle typically means that dashboards are not responsive to change.
General – because customisation is difficult and time-consuming, visuals and metrics are designed to be relevant to as many users as possible. As such, it may not address specific needs.
Simplistic – Can over-simplify, making it difficult to explore and uncover nuances in complex data sets or lead to misinterpretation based on how the data is presented.
A dashboard you can converse with
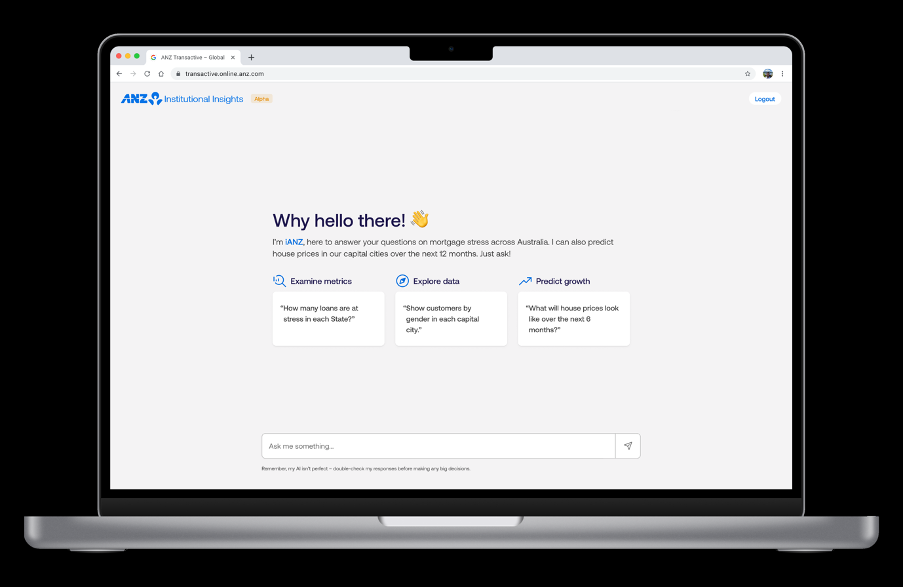
Technologies like GenAI are allowing us to continuously build on our Economic Pulse capability to be even more intuitive and dynamic, appealing to a wider range of users by going beyond the limitations of a predefined dashboard and enabling users of all technical abilities to access insights from the underlying data using natural language queries.
For example, one of today’s limitations is that our dashboard shows total spend in a given industry, which is calculated in the data pipeline before being presented in the dashboard. If the customer wanted to perform analysis based on average spend, we would need to build this as an ad-hoc service request via our data team. Similarly, analysis involving correlations would also be outside the abilities of a dashboard and be managed as a bespoke engagement — a valuable but time-intensive activity.
GenAI allows middle processing layers to be replaced with more dynamic algorithms. So instead of manually filtering the dashboard down to the relevant state, industry, demographic and timeframe, or engaging the bank on a bespoke query, a user can simply ask ‘what other industries correlate with the trends in my industry over the last 6 months?.’
What the user will get is a direct response to their question, identifying the correlating industries, and visualising these correlations on a graph, along with an underlying data table — all within the space of a few seconds. What was once a bespoke, resource-intensive engagement for both the customer and the bank, is now a real-time messaging conversation between a user and an AI.
Real-world applications
Some of the business decisions that our customers commonly ask for help on are around where to place their next store, or how they should spread their inventory across existing stores. Our GenAI offering will allow them to understand which areas have shown the greatest resilience to downward pressures like cost of living or mortgage stress. All through a simple natural language query.
The benefit to our customers is substantial as it democratises the power of our data, and puts the outputs of advanced data analysis techniques and big data into the hands of anyone with the ability to ask the right question.
Delivering a GenAI-powered data capability
While GenAI provides greater access to the less tech-savvy, it by no means reduces the need for engineers. In fact, more customer-facing use cases will increase demand by service providers for engineers skilled at ensuring data quality and integrity, tool development, efficiency and upholding ethical standards of use.
Deploying GenAI for a customer-facing use case is not for the faint-hearted. We used a variety of modern tools and technologies, and faced a number of technical, and learnt a few things along the way. To give you an idea, here is a summary of the tools we used, challenges we faced, and things you need to get right.
Tools we used to make this work
Google Cloud: Provides the infrastructure and services to host and run the application.
Vertex AI Generative AI: Used to enhance the AI capabilities of the platform by leveraging advanced machine learning models.
Synthetic data: Employed in an isolated environment to evaluate the performance of the Multi-Agent System (MAS) without using real data.
Kubernetes Engine: Manages the deployment, scaling, and operation of the application in a containerised environment.
BigQuery: Stores and manages the data used by the application, providing powerful querying capabilities.
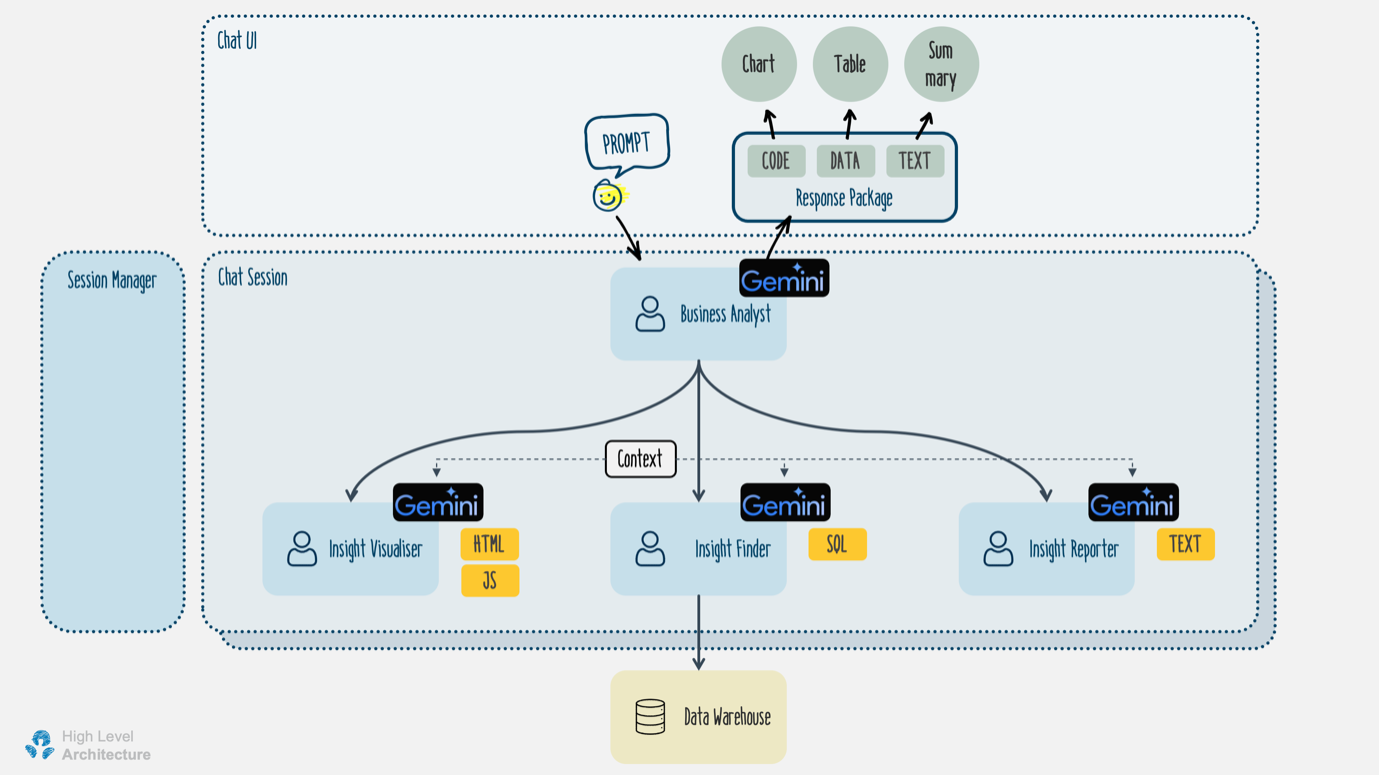
Multi-Agent System: We created a team of AI agents, each with their own specialisation, to collaborate and provide a coordinated response to the user’s question.
Business Analyst Agent: This agent is responsible for receiving requests and responding with data and summary text. The Business Analyst Agent also coordinates with other agents in the system, including the Insight Finder, Reporter, and Visualiser. Additionally, it performs initial screening of prompts and validates responses from the Generative AI models.
Insight Finder Agent: This agent focuses on finding insights based on prompts from the Business Analyst Agent. The Insight Finder relies on Generative AI to generate SQL queries for finding insights. It also needs to keep track of the data context to ensure it retrieves the relevant query for each prompt.
Insight Visualiser Agent: This agent is responsible for writing data visualisation code based on the results from the Insight Finder. All generated HTML and JavaScript code are sent to the front end for dynamic rendering of charts and tables. The Insight Visualiser also uses a Large Language Model (LLM) model to generate the front-end codes.
Insight Reporter Agent: This agent generates summaries of data provided by the Insight Finder.
This team of agents is integrated with other components of a typical chat application, including the front end and a back end with a session manager, and a data warehouse for hosting aggregated and anonymised consumer spending data.
Challenges we faced
Inaccuracies encountered in testing
We encountered some inaccurate and inconsistent responses from the model in the lab during testing, even with the model’s temperature (parameter to control randomness) set to 0. Another issue we encountered in the lab was hallucination, where the model provided answers outside the relevant data context. After several iterations of prompt tuning and implementing rule-based validations, we were able to significantly improve the model's accuracy for SQL generation and data summarisation tasks prior to launch.
Insight visualiser agent challenges
The biggest challenge for the multi-agent system was the Insight Visualiser Agent, which is responsible for generating visualisation code based on data from the Insight Finder Agent. The charts need to adhere to ANZ's standard colour scheme, and the code had to be 100% accurate for the browser to render correctly. Even a single typo or mismatch between the data and the JavaScript code would result in errors on the user’s browser.
Extraction vs. generation tasks
We learned that with LLMs, extraction tasks are more accurate than generation tasks. The model performed better when extracting information from the data rather than generating code from the data and template. We developed a simple process using the LLM to extract field names and other hidden characteristics, overlay them onto a template with ANZ colour codes, and then separately combine the data with the code template to create a complete visualisation. This approach proved to be more accurate than instructing the model to generate the entire visualisation, including data and code, in one step.

Things you need to get right
Stakeholder engagement
Engaging with enablement stakeholders throughout the journey is critical. For example, we collaborated with Data Governance, Security, and Risk teams to build a solution using real consumer spending data. We familiarised them with the emerging technology, its technical aspects, and potential opportunities. Through consultations and assessments, we gained a comprehensive understanding of the risk and security landscape, along with ethical and safety concerns. These insights were then discussed with our Google partners to enhance our cloud and AI controls and guardrails.
Removing data siloes
Traditional businesses seeking to transform into modern digitally-enabled businesses need to convert the invaluable pockets of data hidden away in siloes across the organisation into an enterprise-wide resource accessible by all who need it.
Guarding against training biases
When building GenAI solutions for customers, it is crucial to guard against training biases. This involves identifying and mitigating any biases in the training data that could lead to unfair or inaccurate outcomes. By conducting thorough data audits and implementing bias detection tools, we ensure that our models are trained on diverse and representative datasets. Regular reviews and updates to the training process help maintain fairness and accuracy, ultimately leading to more reliable and equitable AI solutions for our customers.
Response times
Response times have a significant influence on the user’s experience of the AI model. In one instance, the GenAI model exhibited unacceptable latency, with response times averaging 23 seconds, rendering it unsuitable for production. Efforts to reduce latency through streaming were unsuccessful, as the initial data still took about 22 seconds to arrive. The root cause of this latency was identified as the Requests library wrapped in VertexAI. Even when set to stream, the Requests library took the same time to receive the response header as Curl did to receive the entire data. This was due to the server compressing the data using gzip, which cannot be streamed. We resolved this by setting the server to only send non-compressed formats, thereby allowing streaming.
Conclusion
We believe customers will greatly appreciate tools that offer actionable insights in a user-friendly way, and GenAI has a big role to play in this. Natural language queries enable our offerings to move from fixed dashboards to allowing users to query our rich data set in a dynamic, intuitive and conversational way.
When done well, GenAI can be applied to democratise data, making insights accessible to even the most non-technical of users across all departments of an organisation. For our customers, this ultimately means being equipped to make better decisions and stay competitive in a digital world.
Louise is the Head of Data Science for ANZ’s Institutional business. She is an experienced banking professional with expertise in credit markets and in the development and execution of complex transactions. In 2017 she followed her passion for delivering customer centric solutions into the technology realm by managing the test and learn component of ANZ’s agile work transformation. Before starting her current role of Head of Data Science in 2022, Louise was the Product Owner for the development of ANZ’s Digital Credit solutions for Institutional Bankers. She is a strong leader and mentor with the willingness and ability to lead herself and others through change, in adapting to new work practices, styles and market conditions.
Sathish is the Head of Data Platform Enablement at ANZ Banking Group. He has 20+ years of experience in IT with a strong background in Hybrid/Cloud infrastructure and platform development. Sathish leads a team dedicated to enhancing data capabilities and driving innovation within the organisation. His expertise in data strategy, analytics, and technology integration has been instrumental in transforming the company's data landscape.
This article contains general information only – it does not take into account your personal needs, financial circumstances and objectives, it does not constitute any offer or inducement to acquire products and services or is not an endorsement of any products and services. Any opinions or views expressed in the article may not necessarily be the opinions or views of the ANZ Group, and to the maximum extent permitted by law, the ANZ Group makes no representation and gives no warranty as to the accuracy, currency or completeness of any information contained.