How I did data analytics for ANZ's Engineering Portal with GitHub Copilot prompt engineering
By Sergey Stadnik
I am a Typescript developer working on ANZ's Engineering Portal. Engineering Portal (built using Backstage by Spotify) is a developer portal that helps engineering teams build, manage, and maintain complex software systems by providing a centralised platform for managing all their tools, services, documentation, and software components. Our goal is to make it a one-stop destination for all the ANZ software engineers and developers looking for information or documentation on any of the bank's applications.
We care about what we do and about the value we provide. And one of the ways to measure that value is to track the adoption of our Backstage portal across ANZ.
Normally that would be done via an integration with some kind of customer analytics platform, which collects the data and draws fancy dashboards. But there is also an alternative way.
We have logs! Backstage's back-end produces a lot of information stored in logs. Most of that info is irrelevant for our goal. But one piece of info we could use - there is a log record every time a user logs into Backstage. And, because Backstage sits behind single sign-on (SSO) and a user login is mandatory to access it, the number of logins correlates with the portal's user adoption.
So, we just need to extract the logs, filter for the relevant info, aggregate the data and draw the charts. Easy, right?
That's what I thought.
Filtering Google Cloud logs for the relevant info wasn't that hard. Google documentation of their query language is excellent. I ended up with a CSV file, tens of thousands of lines long and 35 columns wide. I needed only 2 bits of information from all that data - user names and timestamps. Then I would need to aggregate the data for every day and by unique users, print out a table and draw a bar chart. That didn't sound easy at all! In fact, I was ready to freak out.
I asked around, and somebody suggested Python Pandas library. The trouble is, my Python is rusty. And, as a Typescript developer, I don't know a thing about data analysis. I was nearly desperate and prepared to give up. However, I decided to give GitHub Copilot a chance first.
I created an empty Jupyter Notebook in Visual Studio Code (VSCode), installed Python and the relevant extensions. (To be more precise, VSCode helpfully suggested to install them for me). Then opened Copilot Chat prompt and started typing:
Step one - Done.
Now, onto a more complex task. Usernames are embedded within a string inside one of the fields. Normally, extracting them would require writing a regular expression. But who has time to craft regexes by hand? Can Copilot assist with this? Let's find out.
Dear CoPilot Chat,
The format of "jsonPayload.message" field is "Issuing token for user:default/firstname.surname, with entities user:default/firstname.surname".
I want to extract names like "firstname.surname" from those strings as "User" field.
Print the resulting User field.
A-a-a-and, Bam! it worked!
Now to the analytics part. I have data for the last month. I want to know how many unique users used our Backstage portal in that period.
Wow, 1717 different people used Engineering Portal in the last month! That's way more than I expected, given how early into our journey we are.
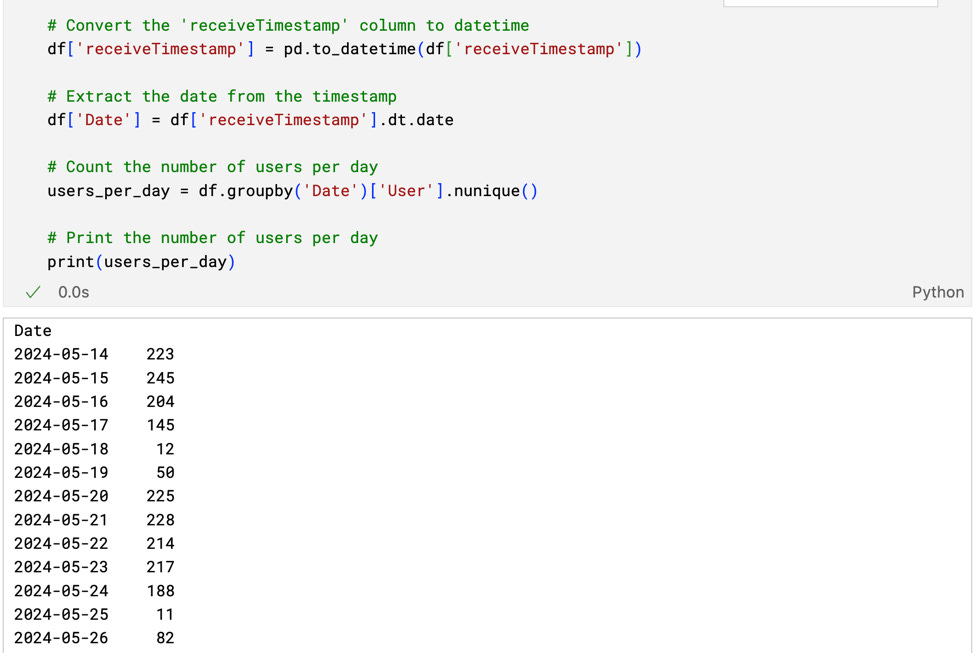
Now, the interesting part. I want to know how many people used Backstage per day. Can CoPilot Chat do that for me?
One of the fields of the log file is receiveTimestamp, which is a timestamp in ISO 8601 format with AEST time zone offset. In order to use it with Python, I needed to convert it to the Python date/time. I used the following Copilot Chat prompt:
Convert the 'receiveTimestamp' column to datetime
Print the number of users per day.
Done!
And now, to the final and most interesting bit. Can CoPilot help me to plot the chart?
Tada!
Impressive numbers! And those are unique users per day.
If we chart non-unique users, which, fair to say, represents user activity, the numbers are even more impressive.
(Non-unique users mean people returning to Backstage after an hour or more, because our authentication tokens expire after an hour.)
All I had to do was to go back into one of the code blocks and ask for non-unique users:
So, here we are.
Data analytics done and dusted with 100% CoPilot Chat prompt engineering and zero code written by hand.
Thanks, Copilot. I wouldn't have done it without you!
Sergey Stadnik is a senior developer at ANZ. He is a highly skilled full stack developer with over 20 years of experience. He has a thorough understanding of all aspects of full-stack software development and has worked in a variety of industries including market-leading financial and retail companies.
This article contains general information only – it does not take into account your personal needs, financial circumstances and objectives, it does not constitute any offer or inducement to acquire products and services or is not an endorsement of any products and services. Any opinions or views expressed in the article may not necessarily be the opinions or views of the ANZ Group, and to the maximum extent permitted by law, the ANZ Group makes no representation and gives no warranty as to the accuracy, currency or completeness of any information contained.


